maglia 5000 smart
Plans where to place sensors on a distribution network, measuring distances along the network rather than as the crow flies.
The problem
On a pipe network, sensors must cover everything without wasting any. Two points close as the crow flies can be very far apart along the pipes, and by hand, across thousands of points, the plan just can’t be done.
The solution
- It turns the network’s geographic data into a graph and computes distances along the network.
- A phased coverage algorithm picks the points respecting a minimum distance, falling back to straight-line distance where the network is broken.
- For each area it produces an Excel sheet, a CSV for GIS, a report and a multi-layer interactive map.
- A map editor that works offline, to refine the plan by hand.
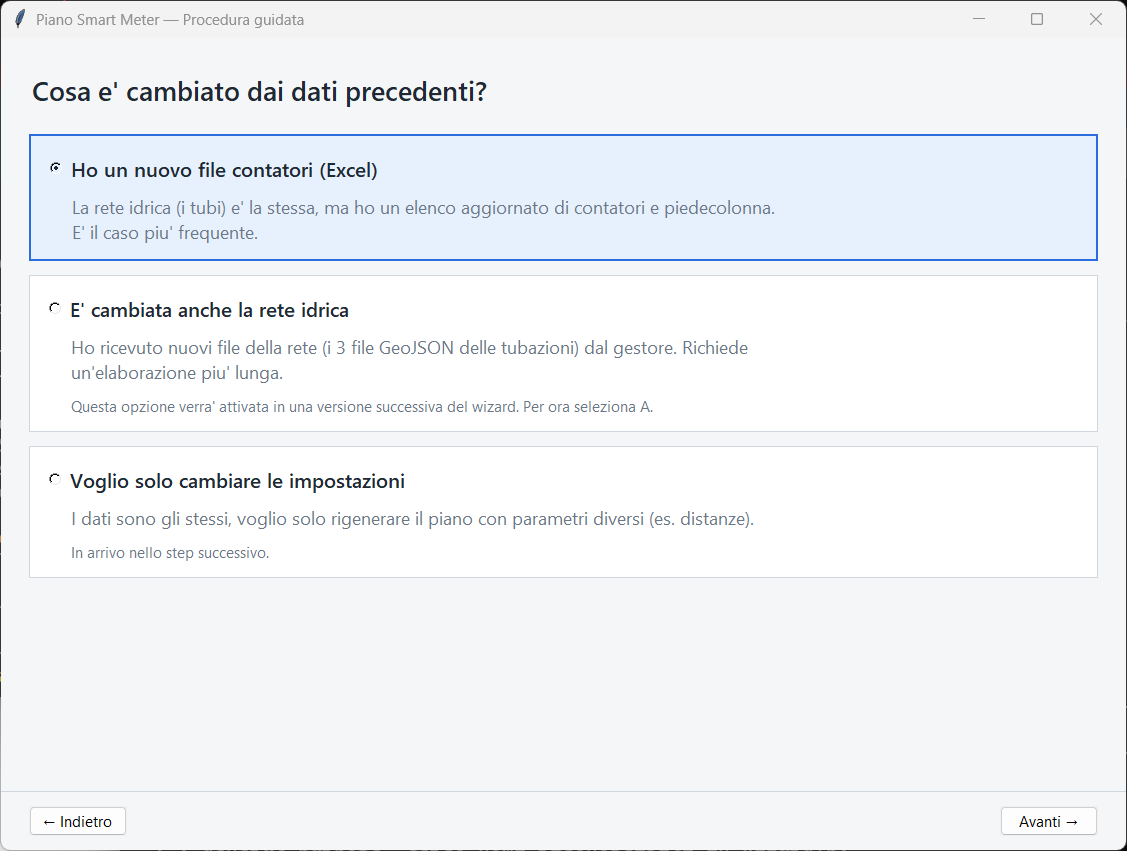
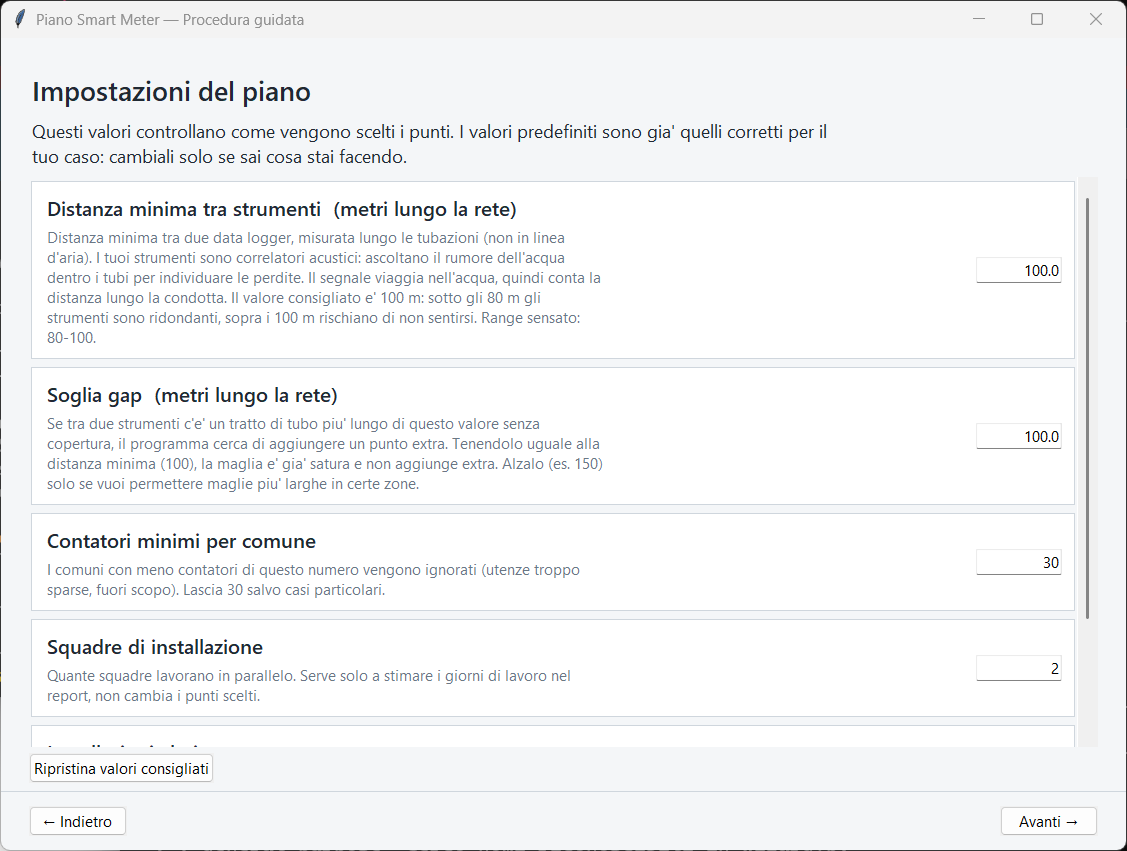
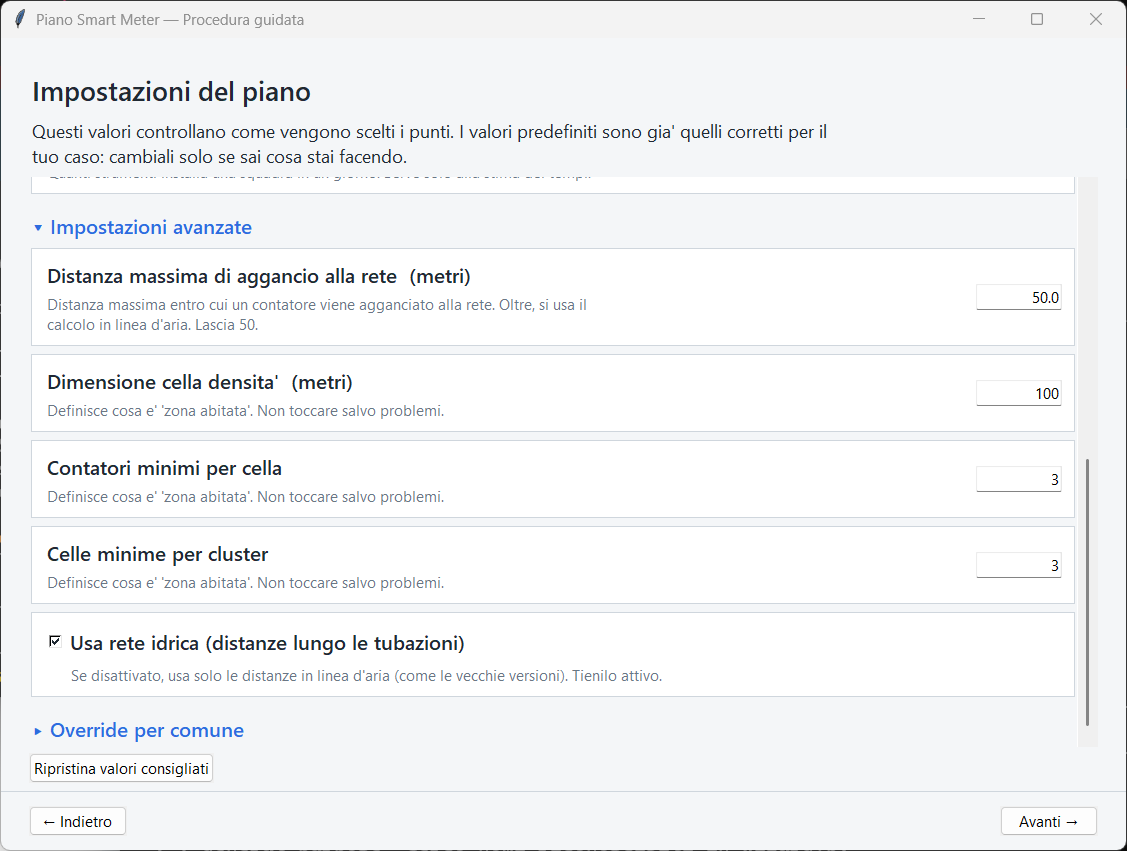
- A guided wizard that works on isolated copies and keeps every extraction with its date.
How it’s built
- Streaming GeoJSON parsing and a weighted graph built with networkx, without GDAL.
- Points snapped to nodes with a spatial search tree (cKDTree), and near-coincident nodes merged.
- Fast geodesic distances, density clustering that automatically names the hamlets, and a Leaflet map generated from code.
Screenshots